Table of Contents >> Show >> Hide
- What Is the Directional Movement Index (DMI)?
- How the DMI Is Calculated (The Short, Trader-Friendly Version)
- How to Read DMI on Your Chart
- A Core DMI Trading Strategy: Trend-Following With Filters
- Combining DMI With Other Technical Tools
- Common Mistakes When Trading With DMI
- Risk Management When Trading With DMI
- What Trading With DMI Really Feels Like: Experience-Based Insights
- Conclusion: Let DMI Help You Trade the Right Battles
Open any charting platform and you’ll see a jungle of indicators: squiggly lines,
heat maps, oscillators, more colors than a pack of highlighters. The
Directional Movement Index (DMI) is one of those indicators that
actually earns its place on your chart. It’s a compact combo of three lines
that helps you answer two of the most important trading questions:
Is there a trend? and Is it worth trading?
In this guide, we’ll break down what the DMI is, how it works, and
how to trade with the DMI and ADX like a rational human instead of a
button-smashing gambler. We’ll walk through practical setups, common
mistakes, and some real-world “this is what it’s actually like” experiences at
the end.
What Is the Directional Movement Index (DMI)?
The Directional Movement Index (DMI) is a trend indicator
created by J. Welles Wilder Jr. in 1978 to measure both the direction and
strength of a price move. It’s made up of three components: +DI, -DI, and
ADX.
-
+DI (Positive Directional Indicator): Measures upward price
movement in other words, how strong the bulls are. -
-DI (Negative Directional Indicator): Measures downward price
movement the power of the bears. -
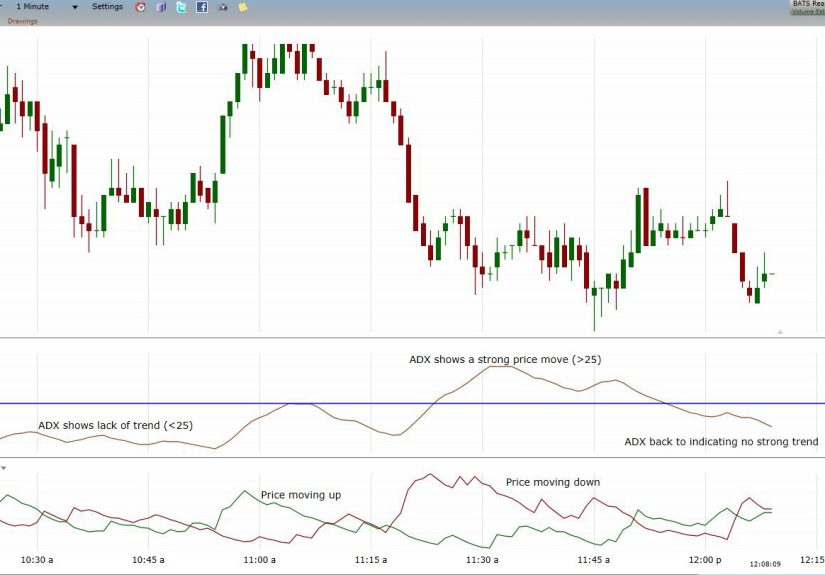
ADX (Average Directional Index): Measures the strength of the
trend, regardless of direction. High ADX = strong trend; low ADX = weak or
sideways market.
In practice, traders use the relationship between +DI and -DI to judge
trend direction, and the ADX value to judge trend strength.
Common ADX Levels and What They Mean
While exact thresholds vary by trader and market, many traders interpret
ADX roughly like this:
- 0–20: Weak or no trend (choppy, range-bound)
- 20–25: Trend is starting to form
- 25–50: Strong trend
- 50–75: Very strong trend (often extended)
- 75–100: Extremely strong trend (also “please tighten your stops” territory)
The beauty of DMI is that it helps you avoid trading when markets are
flat and focus on the times when strong trends are actually worth
your risk.
How the DMI Is Calculated (The Short, Trader-Friendly Version)
You don’t need to memorize the math to trade with DMI, but it helps to know
what’s going on under the hood:
-
For each bar, the system compares today’s high and low to the previous bar’s
high and low to determine directional movement:- +DM: Upward movement (today’s high – yesterday’s high, if it’s larger than the downward move)
- -DM: Downward movement (yesterday’s low – today’s low, if it’s larger)
- A true range (TR) is calculated to account for volatility.
-
+DM and -DM are smoothed over a period (the classic default is
14 periods) and normalized by TR to produce the
+DI and -DI lines. -
The difference between +DI and -DI is compared to their sum to form a
Directional Index (DX), which is then smoothed again to
create the ADX line.
All of this math gets wrapped into a neat package by your trading platform,
so you just see three lines but now you know they’re not random squiggles.
How to Read DMI on Your Chart
Step 1: Add DMI to Your Platform
On most platforms (MetaTrader, TradingView, Thinkorswim, etc.), you’ll find
the DMI or ADX indicator under Trend indicators. The default
setting is usually a 14-period DMI, which is a good place to start.
Step 2: Understand the Basic Signals
-
+DI above -DI: Bullish directional bias buyers have the
upper hand. -
-DI above +DI: Bearish directional bias sellers are in
control. -
Rising ADX: Trend strength is increasing (whether up or
down). -
Falling ADX: Trend is losing strength; conditions may shift
toward range or consolidation.
So, a classic bullish scenario looks like:
+DI on top, -DI below, and ADX rising above ~20–25. A classic
bearish scenario is the opposite: -DI on top, +DI below, ADX rising.
Quick Example
Imagine stock XYZ is trading at $50:
- +DI crosses above -DI
- ADX is at 18 and turning up
Over the next few bars, price grinds up to $53, and ADX climbs above 25.
That’s the market saying: “Yes, this uptrend is real, not just a random
wiggle.” This is the kind of environment DMI is designed to help you trade.
A Core DMI Trading Strategy: Trend-Following With Filters
Let’s build a simple but powerful DMI trend-following strategy
you can adapt to stocks, forex, indices, or even crypto (with tweaks).
1. Market Selection: Trade Only When a Trend Exists
First rule: no trend, no trade.
- Look for ADX rising from below 20 toward or above 25.
-
Skip instruments where ADX is flat and stuck under 20 you’re probably
looking at a choppy range.
2. Long Setup: Ride the Bulls
Here’s one straightforward long strategy using DMI:
-
Trend filter: ADX above 20 and rising (or crossing 25 from
below). - Signal: +DI crosses above -DI and stays above.
-
Entry: Enter long on the next candle close after the
crossover with ADX still rising. -
Initial stop-loss: Below the most recent swing low or below
a nearby support level. -
Exit:
- Take profit at a predefined reward ratio (e.g., 2R), or
-
Trail your stop below higher lows as price moves in your favor,
especially if ADX stays strong.
Example: In an uptrend on a daily chart, +DI crosses above -DI at $100, ADX
is at 23 and climbing. You enter long at $101 with a stop-loss at $96 (below
swing low). As price moves to $110 and ADX reaches 30–35, you trail your stop
to $105 to protect profits.
3. Short Setup: Follow the Bears
The bearish version is simply mirrored:
- ADX above ~20 and rising.
- -DI crosses above +DI and stays on top.
- Enter short on the next candle close after the crossover.
-
Stop-loss above the recent swing high; manage your risk the same way you
would on the long side.
Many traders also combine DMI with breakouts: they wait for +DI to dominate
and ADX to rise while price is breaking out of a consolidation pattern.
That way, the chart pattern gives direction and structure,
while DMI confirms momentum.
Combining DMI With Other Technical Tools
DMI is powerful, but it’s not a standalone crystal ball. Most experienced
traders pair it with other tools to build robust setups.
1. Moving Averages
Use a 50-period or 100-period moving average:
-
Only take long trades when price is above the moving average
and +DI > -DI. -
Only take short trades when price is below the moving average
and -DI > +DI.
The moving average handles the bigger picture trend; DMI tells you when the
trend actually has enough strength to be worth trading.
2. Support and Resistance
You can tighten your entries by waiting for price to break through a key
level with DMI confirmation:
-
Price breaks above resistance while +DI > -DI and ADX is rising potential
breakout long. -
Price breaks below support while -DI > +DI and ADX is rising potential
breakout short.
3. Oscillators (e.g., RSI)
Many traders mix DMI with RSI or similar oscillators:
-
Use DMI/ADX to confirm a strong trend, then use RSI pullbacks (e.g., RSI
dips toward 40–50 in an uptrend) as more tactical entry points. -
This helps avoid chasing parabolic moves and encourages entries on
retracements instead of emotional FOMO breakouts.
Common Mistakes When Trading With DMI
1. Trading ADX Alone
ADX measures trend strength, not direction. Relying only on ADX
without looking at +DI and -DI, price action, or market context is a fast way
to get confused.
Always combine ADX with at least:
- +DI vs. -DI relationship (who’s in control?)
- Basic trend structure (higher highs/lows or lower highs/lows)
2. Entering Too Late
ADX is a lagging indicator. By the time it’s above 30–40, the
trend may already be mature. Waiting for “perfect” confirmation can mean
entering near the end of the move.
A more balanced approach is:
- Watch for ADX turning up from below 20–25 while +DI/-DI start to separate.
-
Use price patterns and risk management to protect yourself instead of
requiring ADX to scream “this is a strong trend” before you act.
3. Using the Same ADX Threshold for Every Market
A “strong trend” in a calm stock index is not the same as a “strong trend”
in a volatile crypto pair. Some traders adjust their ADX thresholds by
asset class for example, using 25 as a trigger in stocks or forex, and 35–40
in more volatile instruments like certain cryptocurrencies.
4. Expecting DMI to Predict Every Reversal
DMI is more about identifying and measuring trends than calling exact tops
or bottoms. It can give early warning when ADX starts falling while price is
still moving, hinting at weakening momentum, but it will not nail every
turning point.
The goal is not perfection. The goal is to catch the middle of big
moves and avoid trading noise.
Risk Management When Trading With DMI
No indicator can save you from bad risk management. To trade DMI responsibly:
-
Define your risk per trade (for example, 0.5–2% of your
account). -
Place logical stops based on structure: below swing lows for longs, above
swing highs for shorts. -
Consider reducing size or tightening stops when ADX gets very high (50+),
as trends can be strong but also extended and vulnerable to snapbacks. -
Don’t stack multiple highly correlated positions just because all of them
show good DMI signals; you’re still concentrated in one theme.
Think of DMI as your trend “radar,” not your entire flight control system.
You still need good risk rules and a clear plan.
What Trading With DMI Really Feels Like: Experience-Based Insights
On paper, the Directional Movement Index looks neat and scientific:
three lines, some thresholds, a couple of crossovers, done. In live
trading, it’s a bit messier and that’s where the real learning happens.
1. The First Time You Learn “No Trend, No Trade”
Many traders start out ignoring ADX and jumping into every +DI/-DI crossover
they see. On a quiet, sideways day, those crossovers fire like popcorn.
Price goes nowhere, you get stopped out three times in a row, and suddenly
“chop” is your new least favorite word.
Then you glance at ADX and realize it was sitting at 12 the whole time,
flatlining like a heart monitor in a medical drama. That’s when the lesson
lands: DMI isn’t just about direction; it’s about knowing when the
market is worth trading at all.
2. Getting Comfortable With Lag
Another experience almost everyone has: you spot a big move on the chart,
then check ADX and see it popped above 25 halfway through the trend.
At first, this feels unfair (“Why didn’t it tell me sooner?”), but then you
realize that confirmation always comes at a cost.
Over time, many traders adjust by:
-
Not waiting for ADX to be “perfect,” but looking for it to start
curling up from low levels. -
Using structure (breakouts, pullbacks, patterns) to shape entries, while ADX
and DI lines give the green light on trend strength.
The psychology shift is big: you’re no longer hunting for the perfect signal.
You’re looking for good enough confirmation plus solid risk control.
3. Seeing the Difference Between “Trend” and “Fast Move”
A lot of newer traders confuse a single giant candle with a genuine trend.
Big news hits, price rockets for one bar, and then spends the next week
drifting sideways. DMI helps you see the difference.
In a true trend:
- +DI and -DI diverge clearly (not just a quick flicker).
- ADX doesn’t just spike it climbs and stays elevated.
Experiencing this a few times teaches you to avoid chasing every dramatic
candle and instead focus on environments where momentum persists, not
just explodes once and disappears.
4. Adjusting DMI to Your Personality and Market
Traders who stick with DMI long-term almost always customize it:
-
Swing traders on daily charts may be happy with the classic 14-period
setting and a 25 ADX threshold. -
Short-term traders on 5-minute or 15-minute charts might use slightly
lower thresholds or different period lengths to make the signals more
responsive. -
In very volatile markets, some traders only trust ADX readings above 30–40
as “strong trend” because otherwise everything looks wild.
The experience here is that no indicator setting is sacred.
DMI works best when you treat it as a framework, test different parameters,
and settle on something that fits both your market and your tolerance for
noise.
5. Learning to Step Aside
One of the underrated “experiences” DMI gives you is the confidence to do
nothing. When ADX is low and flat, +DI and -DI are tangling with each other,
and price is going sideways, the indicator is basically telling you:
“You don’t get paid to be active you get paid to be right.”
Over time, traders who use DMI seriously often trade less but more
selectively. They wait for:
- A clear DI separation
- ADX rising from low levels
- Alignment with a larger trend or pattern
And when those conditions aren’t there, they simply sit on their hands.
That discipline, powered by a simple three-line indicator, is often what
separates hobbyist traders from the ones who stick around.
Conclusion: Let DMI Help You Trade the Right Battles
The Directional Movement Index isn’t magic, but it’s a
remarkably useful way to focus on what really matters: who’s in
control (bulls or bears) and whether the trend is strong
enough to justify your risk. By combining +DI/-DI with ADX, using
logical filters, and respecting risk management, you can use DMI to avoid
low-probability chop and focus on higher-quality trending environments.
Test it on your preferred markets, tweak the settings, and pair it with
sensible tools like moving averages and support/resistance. The goal isn’t
to catch every move just to trade better moves, with more clarity
and less noise.