Table of Contents >> Show >> Hide
- How We Picked the “Worst” Counties
- Quick Snapshot: The Worst Counties (and Why They Keep Showing Up)
- #1 Kern County, California
- #2 San Bernardino County, California
- #3 Riverside County, California
- #4 Los Angeles County, California
- #5 Tulare County, California
- #6 Fresno County, California
- #7 Kings County, California
- #8 Maricopa County, Arizona
- #9 Harris County, Texas
- #10 Cuyahoga County, Ohio
- What These Counties Have in Common
- How to Protect Yourself (Without Becoming a Full-Time Air Scientist)
- Living With It: Real-World Experiences and Survival Tips (500-ish Words)
- Conclusion
If air had a customer-service desk, these counties would be filing complaints daily. This isn’t about “a little smog” or
“that weird haze you pretend is morning mist.” We’re talking about the big two villains of American air quality:
ground-level ozone (aka smog) and fine particle pollution (PM2.5) (aka microscopic troublemakers that go places in your body they absolutely do not pay rent for).
Below are the counties that repeatedly show up where you don’t want to show up: near the top of national rankings for unhealthy ozone days,
short-term particle spikes, and/or year-round PM2.5. The list leans heavily West (hello, geography + heat + wildfire smoke),
but a few big industrial/metro counties outside the West make their appearance, toobecause air pollution is equal-opportunity annoying.
How We Picked the “Worst” Counties
What “worst” means in this article
Air pollution isn’t one single scoreboard. Some places are champions of ozone (hot sunshine + traffic + industry = smog),
others specialize in particle pollution (wildfire smoke, combustion, dust, industrial emissions), and some counties manage to be
overachievers at all of it.
For this ranking, we used a simple rule: counties had to show up near the top of national county rankings for ozone and/or PM2.5
and/or be repeatedly cited as failing multiple pollution measures in widely used public-health report cards. Then we layered in
real-world drivers documented by U.S. environmental agencies, air districts, and public-health guidance (think: traffic, ports, oil and gas,
agriculture, topography, heat, and wildfire smoke).
The pollutants (in plain English)
- Ozone (smog): Not the “good ozone” high up in the atmosphere. This is the ground-level version that forms when sunlight cooks nitrogen oxides (NOx) and volatile organic compounds (VOCs).
- PM2.5: Fine particles small enough to get deep into your lungs (and beyond). Some days it spikes (smoke events), and in some places it stays high year-round (chronic exposure).
Translation: ozone is often a summer problem; PM2.5 is a year-round problem that gets dramatically worse during wildfire smoke episodes and stagnant weather.
Either way, your lungs do not want to be the test kitchen.
Quick Snapshot: The Worst Counties (and Why They Keep Showing Up)
Before we go county-by-county, here’s the vibe:
California’s Inland Empire and Central Valley dominate because they combine emissions (cars, trucks, industry, agriculture, oil and gas)
with geography that loves to trap pollution (mountain bowls and valleys). Add heat and wildfire smoke, and you get a recurring “why is the sky spicy?” season.
- Southern California basin: traffic + goods movement + sunshine = ozone; plus a huge population exposed.
- Central Valley: valley geography + agriculture + transport corridors + winter inversions + smoke = PM2.5 and ozone.
- Big industrial metros elsewhere: petrochemical corridors and legacy industry can push ozone and PM upward.
#1 Kern County, California
Kern County is the kind of place that can serve you a perfect blue sky… right before it serves you a lung workout you didn’t request.
It regularly ranks among the nation’s worst for both short-term PM2.5 spikes and year-round PM2.5, and it also lands high for ozone.
Why Kern struggles
- Multiple emission sources: heavy-duty transport, industrial activity, and energy production in and around the county.
- Valley + basin meteorology: stagnant air and inversions can trap pollutants close to the ground.
- Smoke season: regional wildfire smoke can turn PM2.5 from “bad” to “get inside now.”
The result: air that can swing from “fine” to “are my eyes supposed to sting?” with very little warningespecially during heat waves and smoke events.
#2 San Bernardino County, California
If ozone had a trophy, San Bernardino would need a bigger shelf. It has repeatedly ranked at or near the top nationally for ozone pollution,
and it also posts high year-round particle levels compared with much of the country.
Why San Bernardino struggles
- Ozone chemistry + sunshine: hot, sunny days supercharge smog formation.
- Traffic and goods movement: major freight corridors and steady vehicle emissions feed the NOx/VOC soup that ozone loves.
- Topography: the broader Southern California air basin can trap and circulate pollution, keeping it from dispersing quickly.
Bottom line: this is a place where “beautiful weather” and “high ozone” can be the same sentence. Rude, honestly.
#3 Riverside County, California
Riverside is often the sequel to Los Angeles’ pollution storyexcept the sequel is not calmer, and it does not wrap things up neatly in 90 minutes.
It ranks extremely high for ozone and shows up in national lists for particle pollution as well.
Why Riverside struggles
- Downwind effects: pollution doesn’t respect county lines; it travels and concentrates.
- Commuting + freight: cars, trucks, and logistics activity are a constant emissions pipeline.
- Heat: higher temperatures can worsen ozone formation, making summer smog a recurring problem.
In practical terms, Riverside residents often have to treat the air forecast like a weather forecastbecause it basically is one.
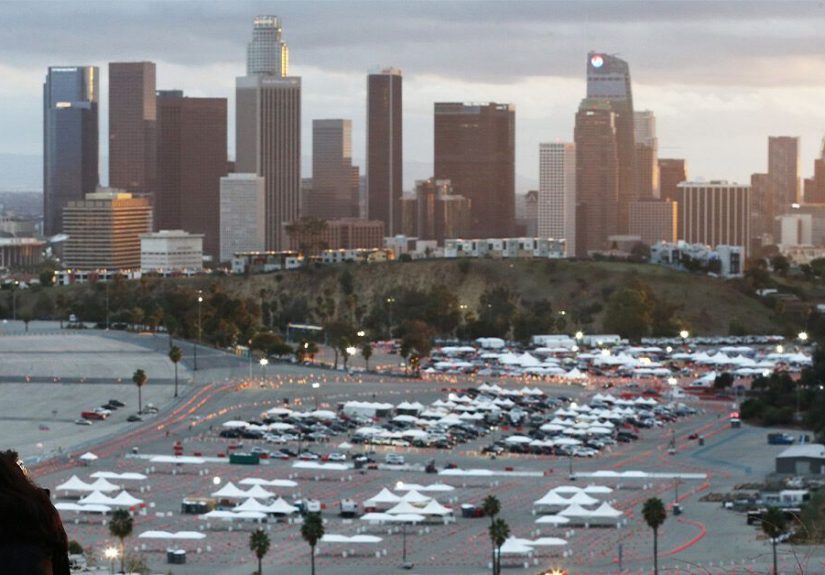
#4 Los Angeles County, California
Los Angeles County has the population exposure of a megacity and the pollution recipe of a lab experiment: heavy traffic, industrial activity, major ports,
and sunshine that absolutely refuses to take a day off. It consistently ranks among the nation’s worst for ozone and remains high for year-round PM2.5.
Why Los Angeles struggles
- Mobile sources dominate: cars, trucks, buses, ships, trains, and equipment generate a large share of ozone-forming pollution.
- Port and freight activity: goods movement adds diesel and other emissions, especially near freight corridors.
- Geography: the basin can hold onto pollution, especially during certain weather patterns.
LA is also proof that a place can make big progress over decades and still rank badlybecause “better than before” isn’t the same as “good.”
#5 Tulare County, California
Tulare County is a repeat offender on national air-pollution listshigh for ozone, high for PM2.5 spikes, and high for year-round PM2.5.
It’s the kind of place where the air can feel like it’s been “seasoned.”
Why Tulare struggles
- Central Valley trapping: surrounding terrain and weather can keep pollution from ventilating out.
- Emissions mix: transport corridors, local combustion sources, and regional contributors combine.
- Smoke + stagnation: wildfire smoke episodes plus stagnant conditions can create brutal PM2.5 days.
Tulare’s pollution story is the Central Valley story: emissions meet geography, and geography wins.
#6 Fresno County, California
Fresno County’s air-quality reputation is so consistent it almost feels like brandingexcept nobody wants this brand.
It ranks high for ozone and is near the top nationally for year-round PM2.5 and short-term PM2.5 spikes.
Why Fresno struggles
- Valley meteorology: calm conditions and inversions can hold pollution close to where people live.
- Everyday sources: traffic, industrial activity, and other combustion-related emissions contribute to PM2.5 and ozone formation.
- Wildfire smoke transport: Fresno doesn’t have to be on fire to breathe smoke.
If you live here, “open a window” is not always the refreshing suggestion it sounds like.
#7 Kings County, California
Kings County is a heavy hitter for particle pollution, showing up high for both short-term spikes and year-round PM2.5.
It’s a reminder that smaller-population counties can still have big air-quality problemsespecially when geography and emissions team up.
Why Kings struggles
- PM2.5 cocktail: combustion-related particles, secondary particle formation, and smoke events can all contribute.
- Central Valley conditions: pollutant buildup can be amplified by limited airflow and seasonal inversions.
- Regional reality: air moves across county borders, so regional emission reductions matter.
Kings County doesn’t need a massive skyline to have a massive PM2.5 problem.
#8 Maricopa County, Arizona
Maricopa County (home to metro Phoenix) is a classic ozone problem in a sun-drenched, fast-growing region. When heat, sunlight, and precursor emissions meet,
ozone shows up like it was invited.
Why Maricopa struggles
- Heat and sunlight: ozone formation thrives on hot, bright daysexactly what Phoenix has in bulk.
- NOx and VOC sources: traffic, industrial activity, and everyday products all contribute to the chemistry that forms ozone.
- Particles, too: dust and smoke can raise particle pollution concerns alongside ozone (different mechanisms, same “ugh” feeling).
Maricopa is also a vivid example of the climate connection: hotter days can make ozone control harder, even when emissions policies improve.
#9 Harris County, Texas
Harris County (Houston) pairs big-city traffic with one of the nation’s most significant petrochemical and industrial corridors.
The result: persistent challenges with ozone and meaningful year-round particle concerns.
Why Harris struggles
- Industrial emissions + traffic: ozone precursors come from both mobile and stationary sources.
- Weather patterns: heat and humidity can influence ozone formation and pollutant behavior.
- Complex air shed: emissions are spread across an interconnected multi-county region, complicating cleanup strategies.
Houston’s air-quality story is not just “cars” or just “industry.” It’s the combinationand the chemistry that happens when the sun gets involved.
#10 Cuyahoga County, Ohio
Cuyahoga County (Cleveland area) appears as a standout outside the West, showing up high on national year-round PM2.5 rankings.
It’s a reminder that particle pollution is not only a wildfire story; it can also be a “dense metro + industry + regional transport” story.
Why Cuyahoga struggles
- Year-round PM2.5 pressures: ongoing combustion sources and regional transport can maintain elevated annual averages.
- Industrial and urban footprint: legacy and active industrial activity in a metro environment can influence particle levels.
- Regional monitoring focus: the area has extensive tracking and planning, which is goodbecause you can’t fix what you don’t measure.
If California counties dominate the “worst” list, Cuyahoga shows that the Midwest can still land a spot when annual PM2.5 refuses to behave.
What These Counties Have in Common
1) Pollution sources that don’t take days off
Cars, trucks, industry, and combustion sources are year-round contributors. Even when a county isn’t “on fire,”
routine emissions can keep PM2.5 elevated and help set the stage for ozone.
2) Weather that makes pollution worse
Heat accelerates ozone formation. Stagnant air and inversions trap pollution near the ground. And wildfire smoke can
travel hundreds (sometimes thousands) of miles, turning a local air-quality issue into a regional one.
3) A lot of people breathing the same air
Population matters because exposure matters. A county can be “moderately polluted” on paper and still represent a huge public-health burden
simply because millions of people live and work there.
How to Protect Yourself (Without Becoming a Full-Time Air Scientist)
Use AQI like you use weather
Check the Air Quality Index (AQI) before long outdoor workouts, especially during heat, wildfire smoke, or stagnant winter conditions.
As AQI rises above 100, it becomes unhealthy first for sensitive groups and then for everyone at higher levels.
Make “clean indoor air” your home’s personality
- Run a properly sized HEPA air cleaner or high-efficiency HVAC filtration during smoke events.
- Keep windows closed when outdoor air is bad (yes, even if the breeze feels “nice”).
- Avoid adding indoor pollution during smoke events (candles, heavy frying, unnecessary vacuuming without HEPA filtration).
Time your outdoor activity
Ozone often peaks in the afternoon and early evening on hot days. If you can, shift outdoor exercise to mornings when ozone tends to be lower.
For particle pollution (especially smoke), timing depends on the eventso watch AQI trends.
Advocate locally (this is the part that actually scales)
Individual choices help, but county-level air quality improves fastest with system changes: cleaner freight, cleaner industrial controls,
electrification, tighter standards, and better monitoring. The boring paperwork stuff is, tragically, very powerful.
Living With It: Real-World Experiences and Survival Tips (500-ish Words)
Living in one of America’s most polluted counties changes your habits in quiet, weird ways. People don’t say “Good morning,” they say,
“What’s the AQI?”like it’s a horoscope, except it’s accurate and occasionally terrifying.
In places where ozone is the headline villain (think parts of Southern California and metro Phoenix), summer afternoons can feel like a
social contract you didn’t sign: “Congratulations, it’s sunnynow please avoid breathing too deeply.” Parents become scheduling ninjas,
moving soccer practice earlier, switching park time to mornings, and learning the difference between “warm” and “ozone-friendly warm”
(spoiler: the second one is rare). Runners get used to routes that maximize shade and minimize traffic, because exercising next to a busy road
on a high-ozone day is basically volunteering to be a chemistry experiment.
In particle-heavy countiesespecially California’s Central Valleythe vibe can shift fast. On a normal day, you might notice a light haze
and move on. On a smoke day, you smell it before you see it. The sky goes from “Instagram sunset” to “apocalyptic orange,” and the neighborhood
group chat turns into a support group: who has an extra air purifier filter, which room is the best “clean air room,” and whether that DIY box fan
filter setup is actually working (it can, if built and used correctly).
A lot of “experience” is really about learning the patterns. Ozone has a season and a schedule; PM2.5 has seasons, schedules, and then
completely ignores both when wildfire smoke decides to visit. People who’ve dealt with this for years often become extremely practical:
keep one well-sealed room, stock spare filters, and treat your car’s recirculation button like a tiny shield. You also learn the sneaky stuff.
For example, the day after a smoke event can still be rough even if the sky looks clearerbecause fine particles and regional conditions don’t
disappear just because the view improved.
There’s also a psychological side nobody advertises. Bad-air days can feel like your town is temporarily “closed,” especially for kids,
older adults, and anyone with asthma or heart/lung disease. And yet, people adapt. Communities build routines: indoor play spaces,
cleaner transit options, stronger public alerts, and a shared understanding that “fresh air” is something worth fighting for.
The weird upside? Once you start paying attention, you become surprisingly good at noticing air quality changesyour eyes, throat,
and energy levels become an informal sensor network. Not the hobby you wanted, but one you might end up with anyway.